Portfolio · Discovery & Delivery
Customer studies: from usage to mobile first
The in-between space of what the figures say and what customers experience, in store and on screen.
- Role
- Head of Design
- Client
- ïdkids Group, all brands
- Deliverables
- The "E-shop & customer 2016" infographic, in-store shadowing and sales staff interviews, multichannel journeys and site structure, benchmark of mobile home pages
- Period
- 2016-2017
- Context
- Ahead of the website redesign
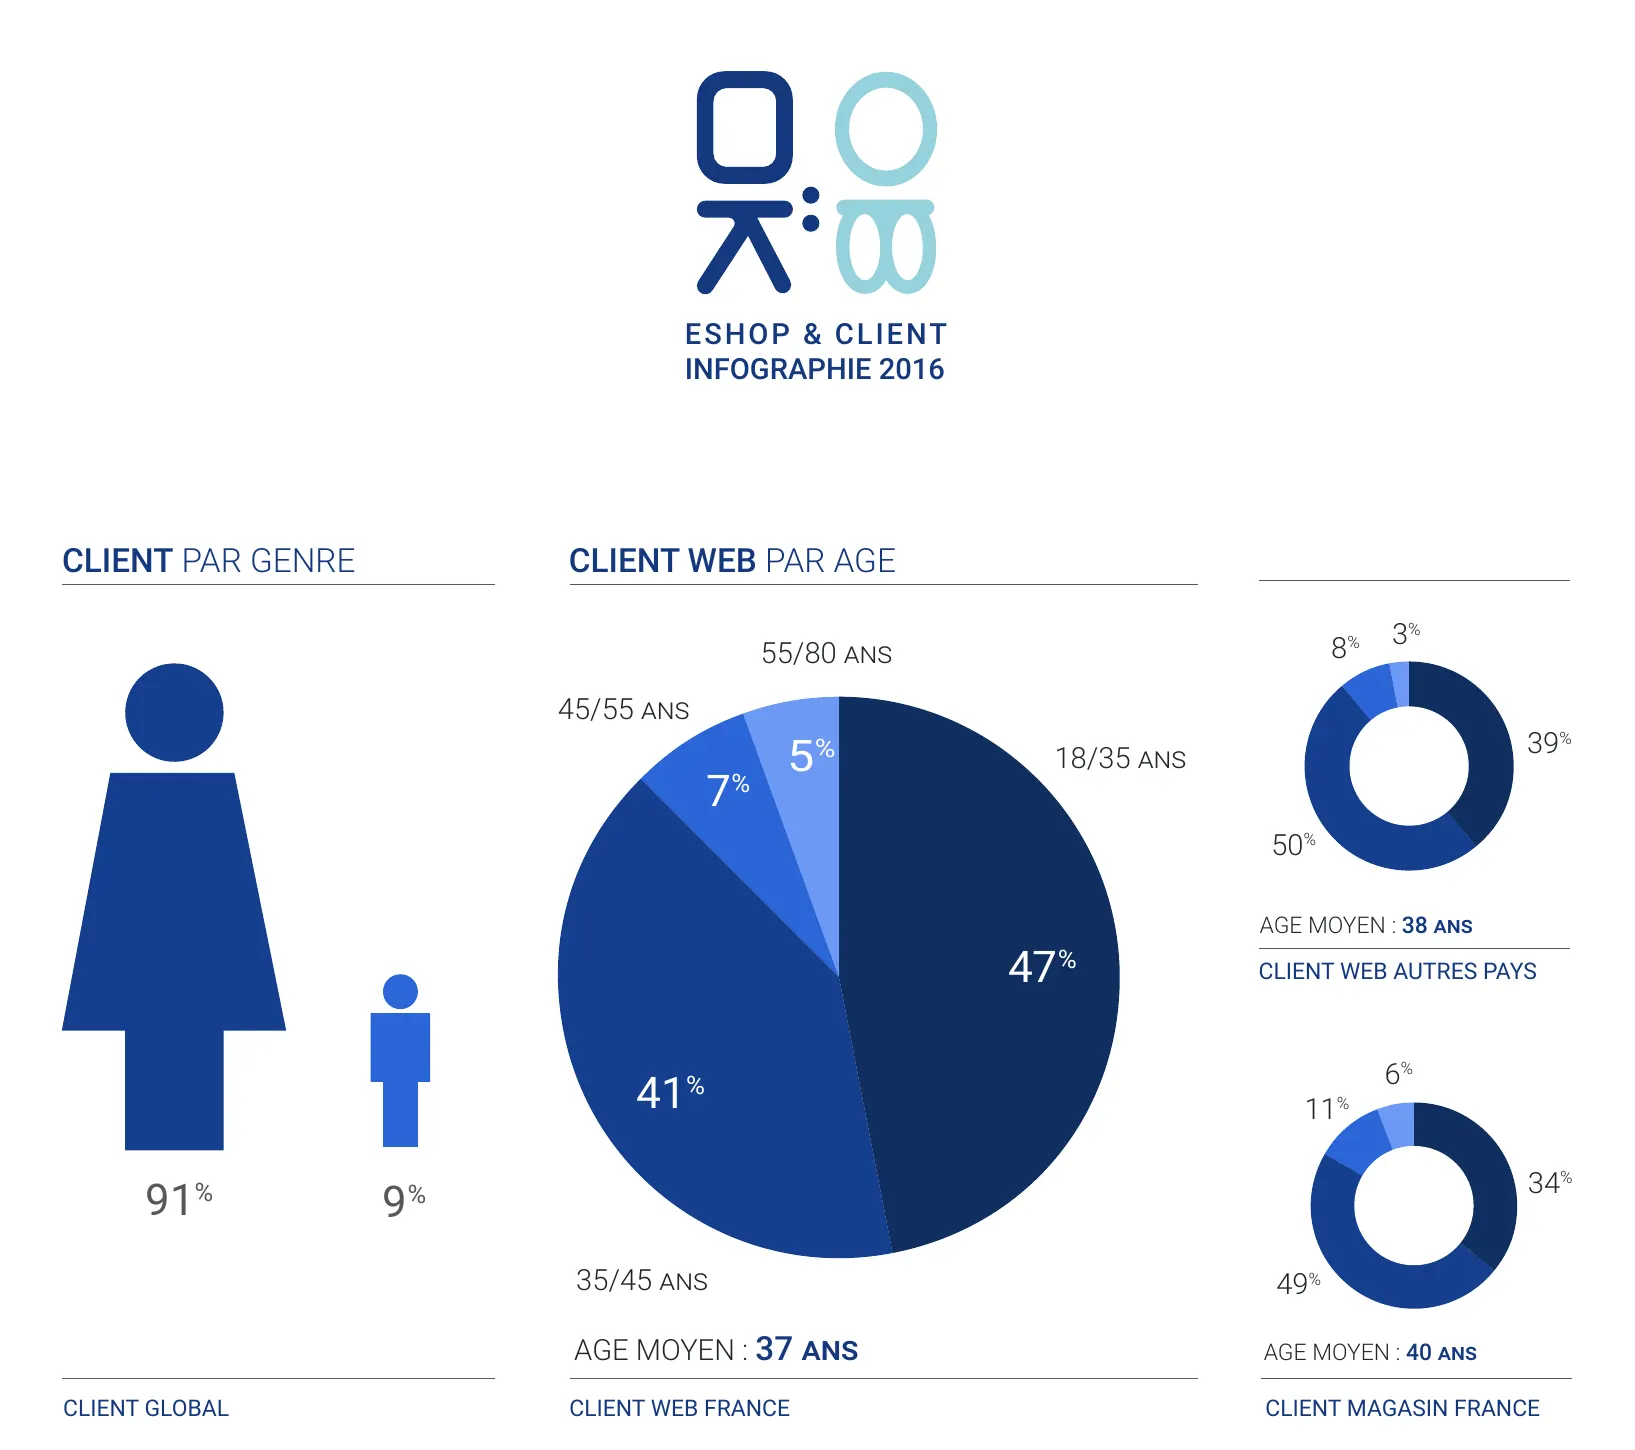
The intent
We were about to tackle the website redesign. Before drawing anything, the risks and opportunities had to be established: for a specific population, for a product that was still fairly new, the e-shop.
Two questions guided the work: how do you establish these risks and opportunities? And how do you turn research into a list of actions?
The mechanics
The challenges
- Making people understand who our customer is.
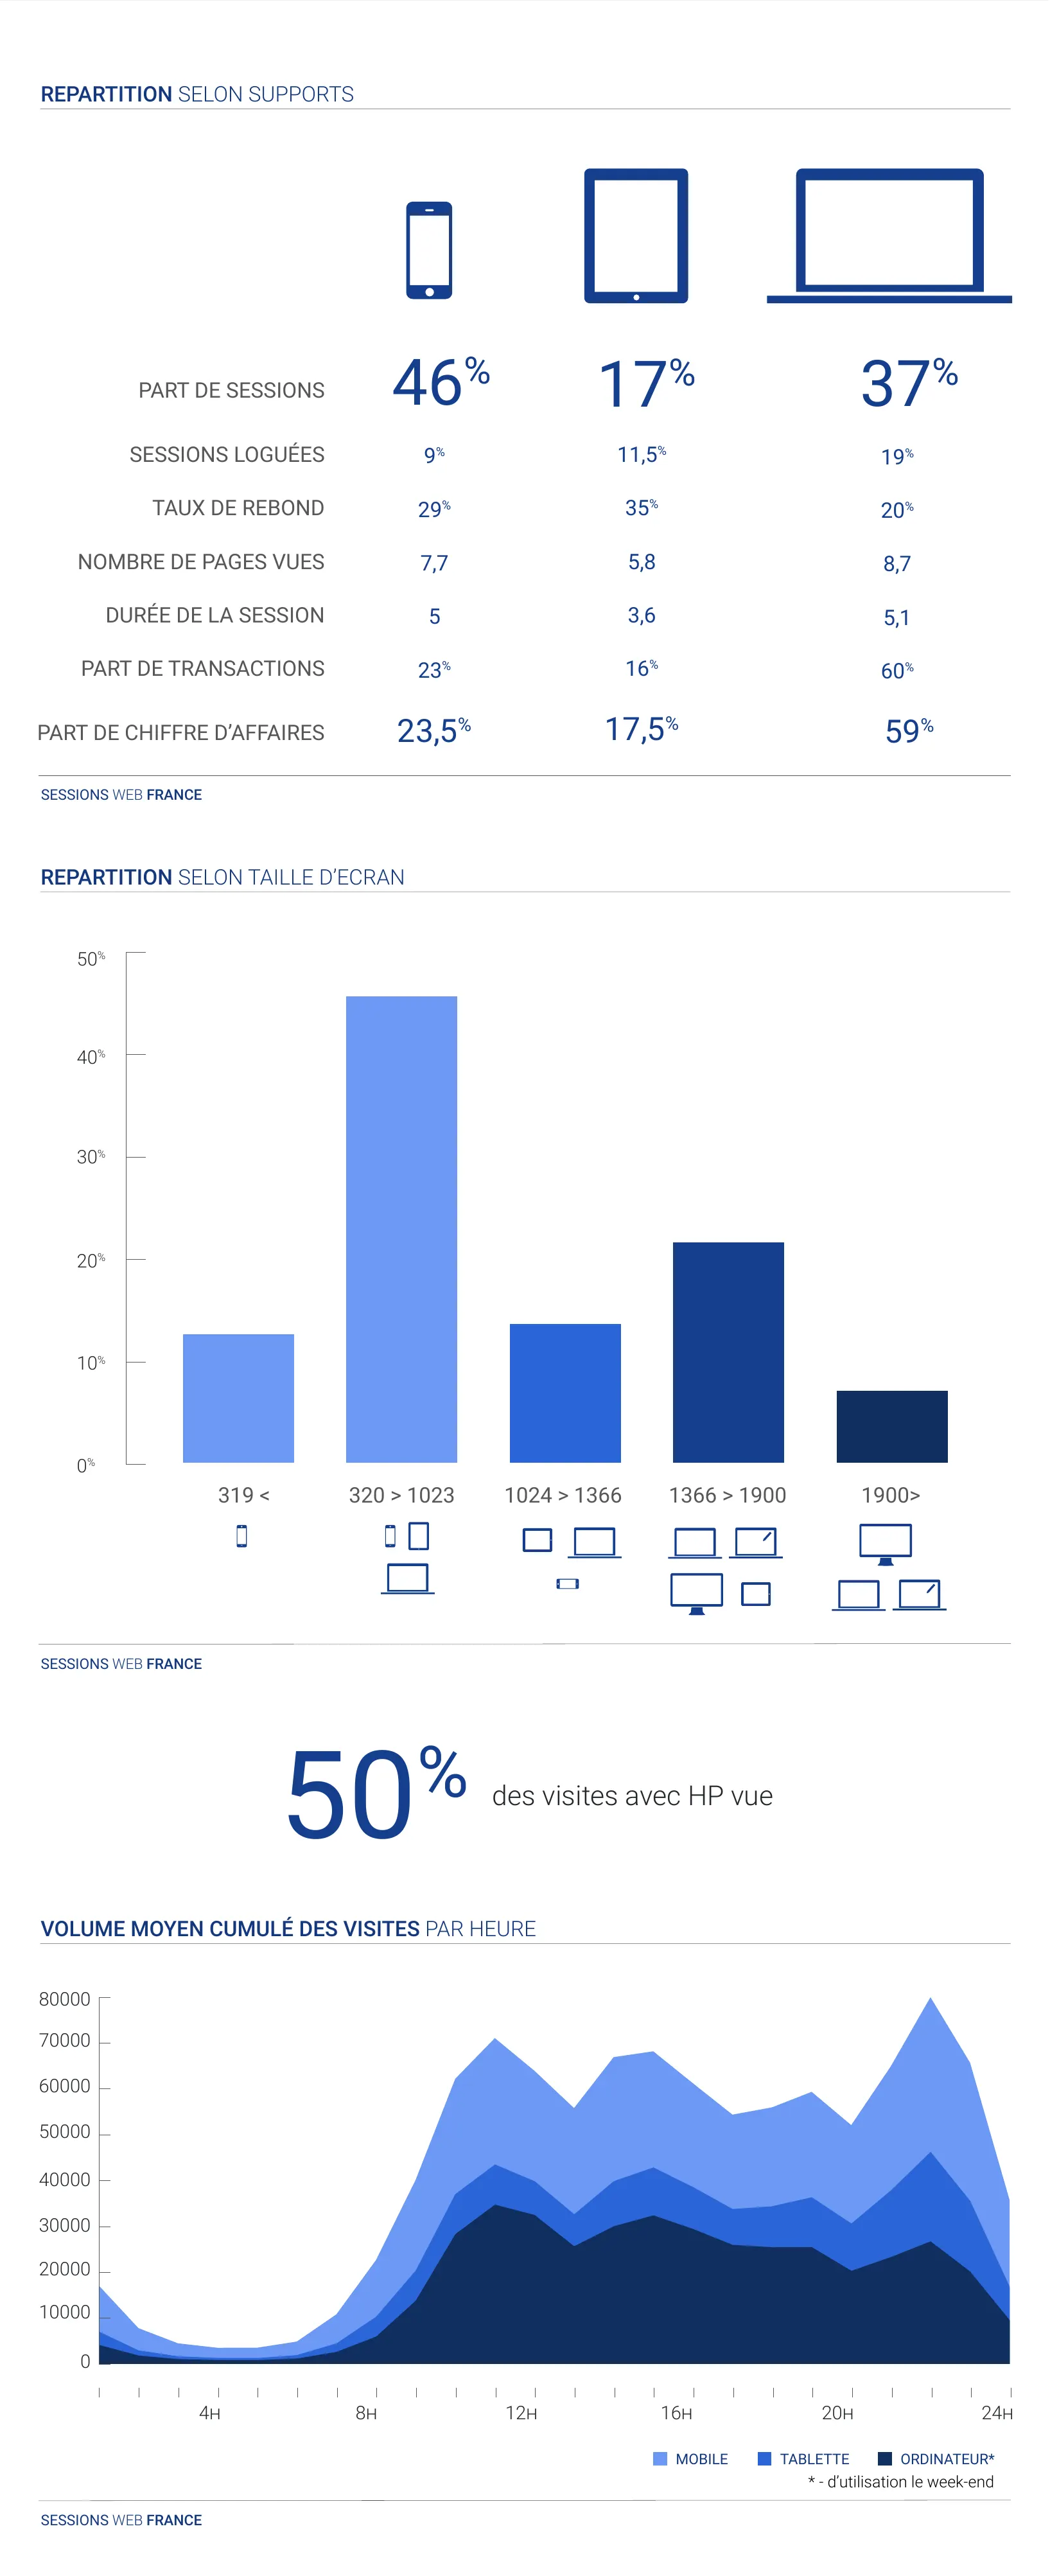
- Showing the rise of mobile.
- Increasing the scope for 360 journeys, between the store and the screen.
The plan
- An infographic, built from CRM data and national statistics (INSEE): who buys, on which channel, how often, with what basket, and on which screen.
- Presenting it to the brand director.
- Fieldwork: in-store shadowing and interviews with sales staff.
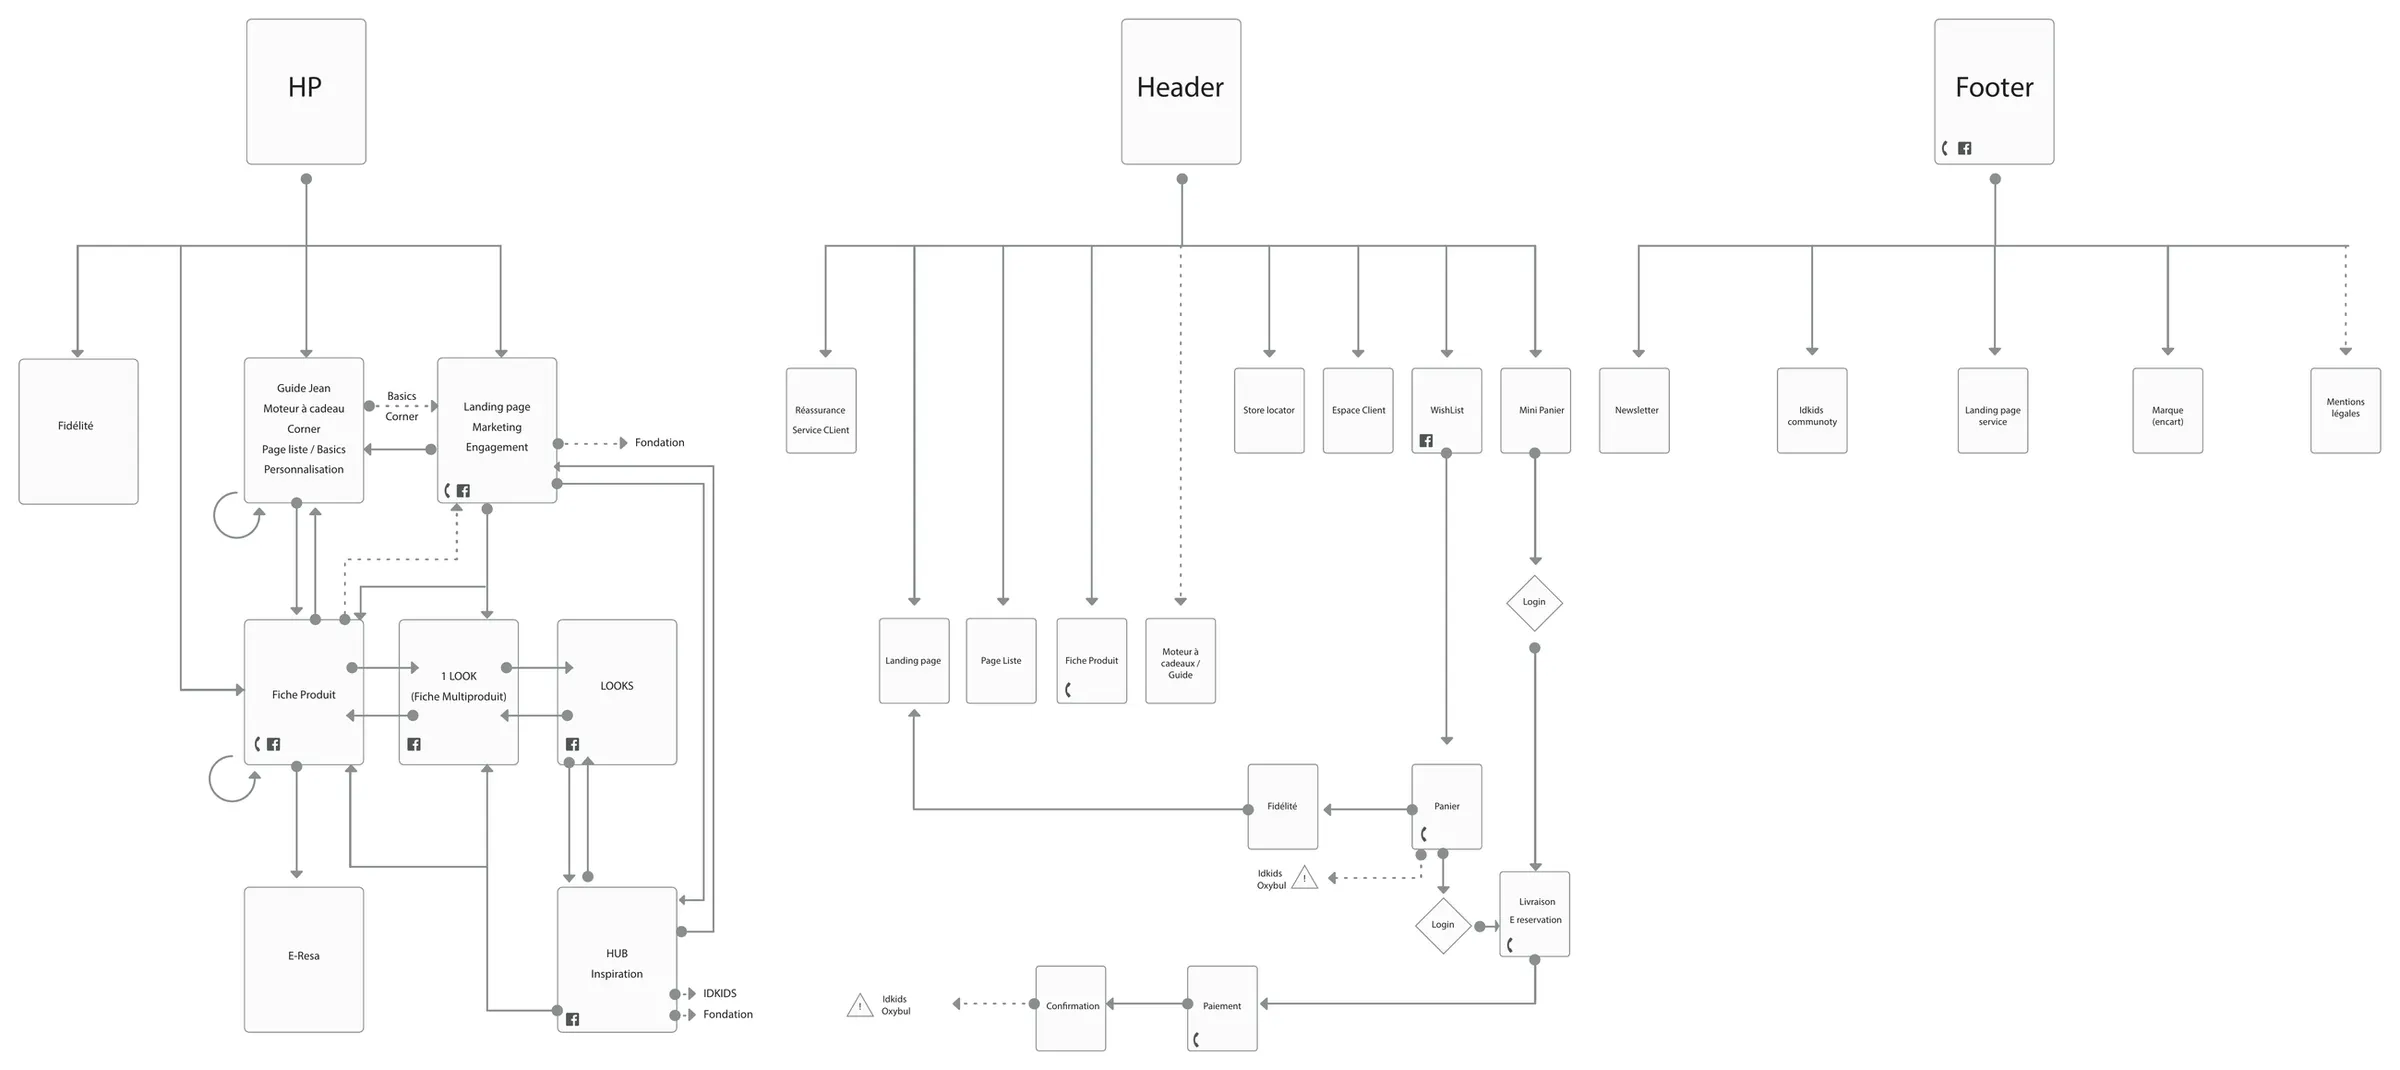
- Multichannel journeys, all reviewed, especially the visibility of promotions.
What struck people was not the sales figures: it was the practices and uses, and the number of types of screen in use.
Evidence and deliverables
- The “E-shop & customer 2016” infographic: customers, channels, baskets, screens.
- Multichannel journeys and the site structure, from the home page to payment.
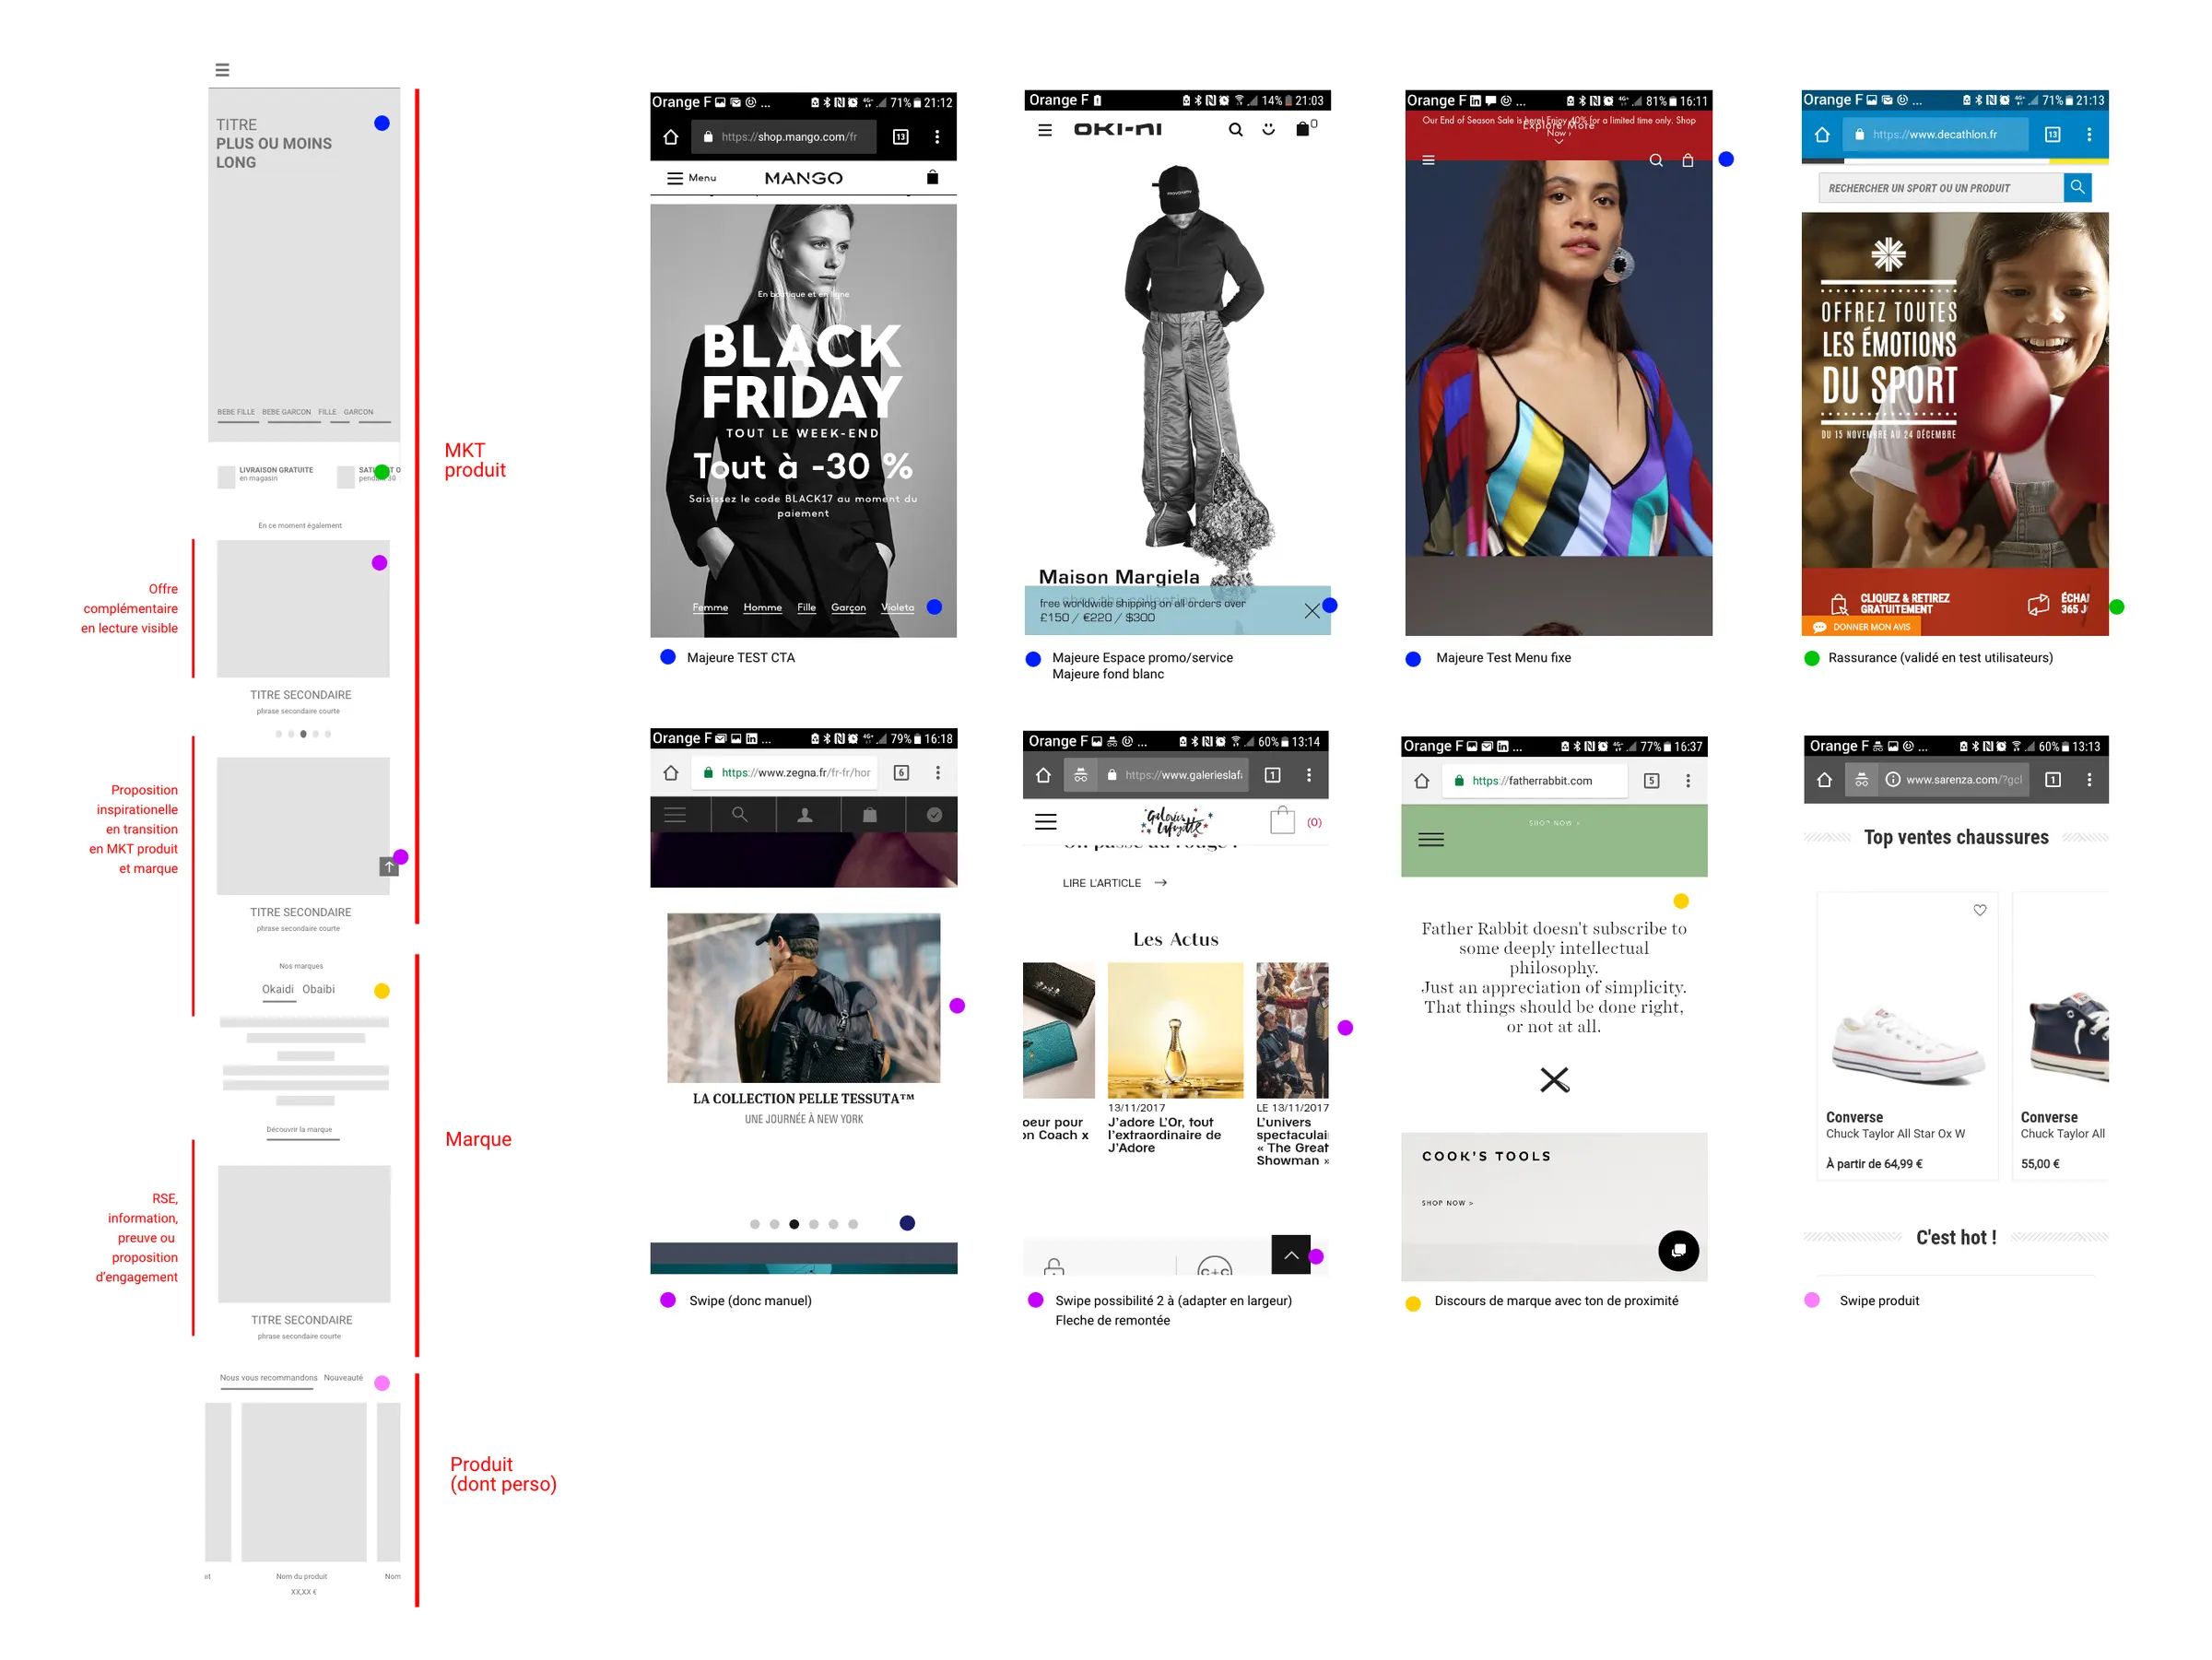
- The benchmark of mobile home pages, with the zoning of the new home page.
The impact
The redesign started from one priority: mobile.